
In today's digital landscape, driving traffic to your website is only half the battle. To maximize your marketing ROI, you must understand exactly how users interact with your pages. Google Analytics 4 (GA4) provides the numbers (pageviews, session counts, conversions), but it cannot show you where users get stuck, what they try to click, or how far they scroll. On the other hand, Microsoft Clarity provides session recordings and heatmaps, but lacks aggregated event tracking. In this advanced data tracking case study, we document the exact framework used by Ashish Kumawat—Advanced Analytics & Tracking Expert in Jaipur, India—to integrate GA4, Google Tag Manager (GTM), and Microsoft Clarity into a single, unified tracking system without hurting site performance.
Step 1: GTM as the Central Data Router
Rather than loading individual, heavy JavaScript SDKs for Google Analytics and Microsoft Clarity directly in the website code, we configured Google Tag Manager as our central data router. This ensures that the browser loads only one tracking container (GTM), which then fires tags asynchronously. In our GTM workspace, we created custom tags for tracking phone clicks, WhatsApp clicks, and form submissions. The Microsoft Clarity tag was also deployed directly via GTM, set to fire on all pages. This clean GTM setup keeps our codebase lightweight and prevents browser thread blocking: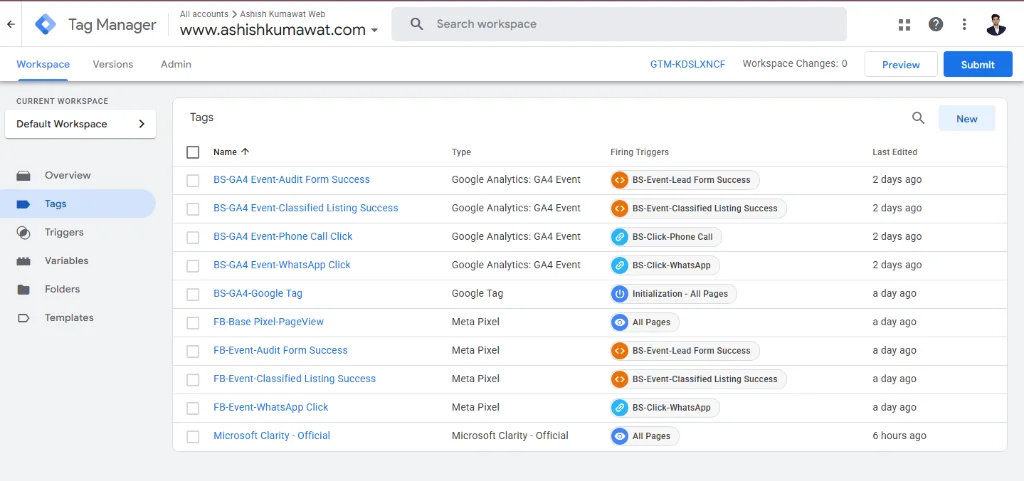
Step 2: Linking GA4 and Clarity with Custom Dimensions
To unlock the full potential of both platforms, we mapped Microsoft Clarity data directly inside GA4 using custom definitions. By capturing the unique Clarity Session Recording ID inside GTM and passing it as an event parameter (clarity_play_link) to GA4, we connected numerical analytics to visual recordings. This allows us to see the exact session recording of any user who triggered a conversion event in GA4. To do this, we registered the parameters as Custom Dimensions in the GA4 admin dashboard under Data Display. This setup ensures that we can analyze user behaviour quantitatively in GA4 and then watch the qualitative screen recording in Clarity to understand why a user did or did not convert: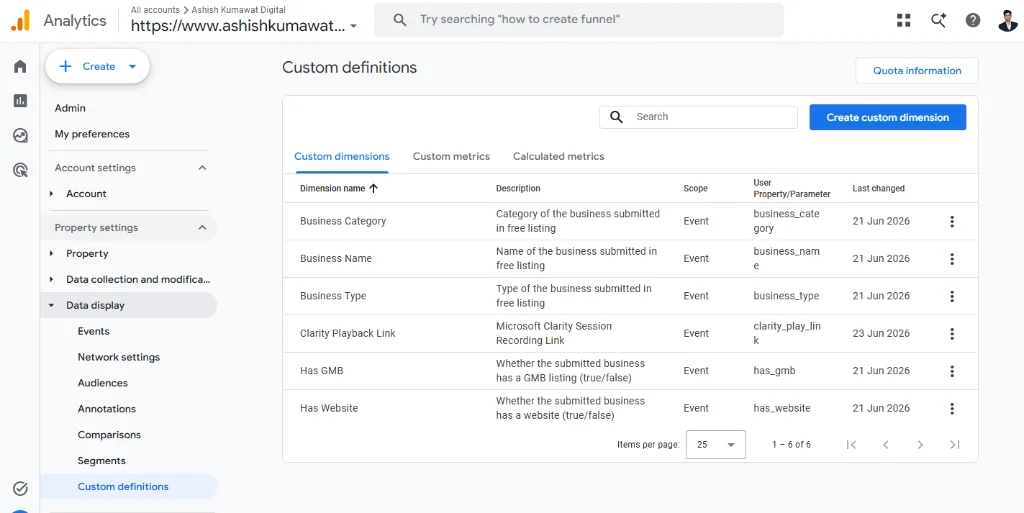
Step 3: Visualizing Customer Journeys with Clarity Heatmaps
With the integration complete, the Microsoft Clarity dashboard displays visual heatmaps showing precisely where users are clicking, moving their cursors, and scrolling on both desktop and mobile. We can easily identify 'dead clicks' (where users click on elements that aren't links) and layout issues that cause rage clicks. This data is invaluable for optimizing landing page layouts, refining call-to-actions, and boosting conversion rates for our paid Meta Ads and Google Ads campaigns: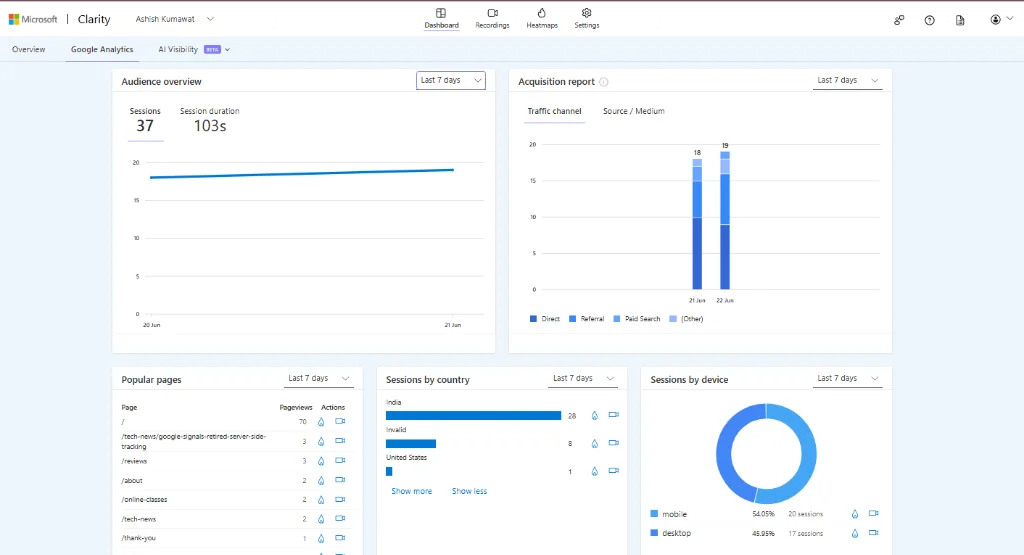
Maximize Your Marketing ROI with Custom Tracking Setup
Without accurate tracking, you are marketing in the dark. Setting up Google Tag Manager, GA4 custom dimensions, and Microsoft Clarity heatmaps is the only way to verify which traffic sources (Meta Ads, Google Ads, SEO) are actually driving business value. If you want to configure a robust data tracking system, implement server-side tracking, or optimize your website's conversion rates, I can help. As an Advanced Analytics & Tracking Expert based in Jaipur, I configure analytics that turn visitors into paying customers. Book your free digital audit today and let's optimize your digital infrastructure.


